Drought Hazard Assessment
| Saint Lucia Drought Hazard Assessment |
![]() About this
page
About this
page
Welcome to the drought hazard page, the national entry point for drought of the Government of Saint Lucia.
This page was developed as part of the Second Disaster Management Project "Development of Drought Hazard Maps for Saint Lucia" (IBRD Loan # 7238-SLU, IDA Credit # 3936-SLU), conducted in 2007 by the consultant DRM (www.drmonline.net).
This page explains briefly what drought is, presents the products that have been developed during the conduction of the project, and directs the interested audience to the competent governmental offices.
Select one of the following topics:
- Drought maps
- Maintenance (requires password)
Drought is a prolonged, abnormal dry period. Drought is a naturally occurring feature of climate and is present in all climate zones of the world. Drought is the consequence of a temporary lack of precipitations which can last from months to years. The longer the deficiency of precipitations lasts, the more evident are the consequences of drought for human activities and the environment.
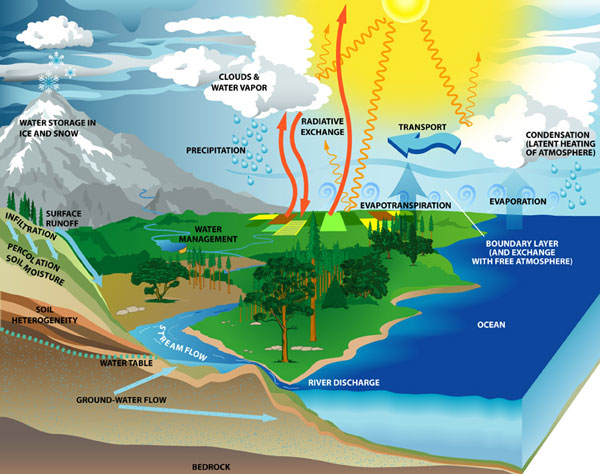
Drought affects the whole water cycle, its triggering factor is a deficiency in precipitation (source: www.esipfed.org).
Drought affects the whole water cycle, the severity of drought is given by its duration. The triggering aspect is a deficiency in precipitation, which results in a meteorological drought. Additionally, high temperatures, wind and low humidity may contribute to drought. A lack of precipitations reduces water infiltration into the ground and groundwater recharge, As a consequence soil water deficits may develop into an agricultural drought, where plant water stress reduces biomass production and yield. Finally, the lack of water results in reduced run-off phenomena: diminished stream flow, lake and reservoir levels thus manifest a hydrological drought.
The following image illustrates the complexity of drought, its temporal evolution and impacts.
The triggering deficiency of precipitation is responsible for a typical sequence of meteorological, agricultural and hydrological drought (from www.drought.unl.edu).
The Consequences of Drought
Drought affects the environment and human activities, having social and economic consequences, such as drinking water shortages, agricultural yield reduction, and limitations on touristic activities.
How can Drought be measured?
It is not possible to measure drought directly. But there are number of ways to assess and measure parameters which are linked to the water cycle, such as precipitation, soil moisture, river run-off, etc. Two approaches have been developed in the project:
- The Drought Susceptibility Map analyzes and combines several factors that may contribute to drought and presents a map of the extent to which the environment would suffer from a drought without considering the likelihood of exposure.
- The Drought Monitor calculates automatically two drought indices, which are both based on precipitation, the Standard Precipitation Index and Deviation from Normal. The Drought Monitor presents an up-to-date evaluation of the triggering aspect of drought, the lack of precipitation, in Saint Lucia.
Drought susceptibility is the extent to which the environment would suffer from a drought without considering the likelihood of exposure.
The drought susceptibility map gives a semi-quantitative overview of which areas of Saint Lucia are subject to drought. This map is the result of an analysis of the contributing factors of the natural and built environment, presenting drought susceptibility in a color-coding ranging from green (low susceptibility) to red (high susceptibility).
Link to the Drought Susceptibility Map.
Methodology
The drought susceptibility map is the base cartography for Saint Lucia regarding drought. Its analysis is based on a semi-quantitative analysis of the factors that may contribute to drought, evidencing the areas of Saint Lucia which are more or less exposed to drought, in terms of a classification ranging from low to high susceptibility.
Several aspects of the natural and built environment contribute at variable extent to drought. They are analyzed using geographic information system (GIS) analyses. The environmental factors that were considered are:
- The annual water balance defines the availability of water and is thus the most important, fundamental factor. The water balance is given as the difference between rainfall and reference evapotranspiration.
- The flow accumulation is the product of a GIS analysis, evidencing the run-off patterns that naturally develop due to topography. It is qualitatively equivalent to the vicinity to a drainage network. Areas closer to surface water are less susceptible to drought.
- Areas of higher average annual temperatures are more prone to drought.
- The moisture supply capacity of the soil determines how fast a type of soil loses its water content.
- The type of land use determines heavily its susceptibility to drought. This factor tries to introduce human activities, giving e. g. urban areas a high and original tropical forest a low susceptibility.
Each environmental aspect was classified in a GIS analysis and received a rating from 1 (low) to 5 (high) susceptibility. The total susceptibility is the weighted average of all the partial aspects and is represented in the Drought Susceptibility Map, using a color coding, ranging from green (low) to red (high susceptibility).
Drought can affect all activities that rely on the sufficient availability of water. This map shows the vulnerability to drought of population and infrastructure for surface water abstraction.
Link to the Drought Vulnerability Map.
Methodology
The population may be impacted by drought by loss of agricultural production and shortage of water supply for domestic consumption. The degree of vulnerability of the population due to drought as shown on the map is the result of an overlay of population density and drought susceptibility.
Diminishing stream flow can lead to reduced water collection. The vulnerability of the infrastructure for water abstraction is expressed in terms of the location of the water intakes with regards to drought susceptibility.
Both aspects are classed into 5 levels of vulnerability, using a color coding, ranging from low (green) to high vulnerability (red).
The crop suitability map indicates the areas of ideal growth conditions for two model crops on Saint Lucia. It uses three environmental boundary conditions - annual total rainfall, average temperature and soil drainage capacity - to identify the areas of ideal growth for these types of crops on Saint Lucia.
Link to the Crop Suitability Map.
Methodology
The Crop Suitability Map addresses drought and agriculture and shows the effects of climate change. It shows the areas of ideal growth for two model crops, a medium water-demanding crop and a high water-demanding crop. The areas of ideal growth are where the criteria of annual rainfall, average annual temperature and soil drainage capacity are met.
The effect of climate change is analyzed using the A1B scenario of IPCC 2007. It describes the climate change for the next 100 years of a world, which has a rapid economic growth and a population which peaks in the middle of the 21st century and then decreases. The energy is produced by a wide spectrum of technologies, including technical improvements.
The consequences of climate change in the Caribbean are an increase in temperture of 2.5 °C and a decrease of precipitations of 20% by the end of the 21st centhury. The Crop Suitability Map shows the areas of ideal growth conditions at present and at the end of the 21st century.
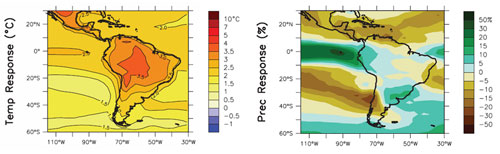
Due to climate change, in the Caribbean, the temperature will increase by 2 to 2.5 °C and precipitations will decrease by 15 to 20% by the end of the 21st century (Data source: IPCC, 2007).
As a consequence of climate change, the vegetation and crops must migrate to higher elevations in order to find areas of ideal growth conditions, leaving space for alternative vegetation and crops. The areas at lower elevation will be even more susceptible to drought.
The drought monitor informs about the current situation regarding drought in Saint Lucia. It calculates automatically two indices that target on the triggering factor of drought, the lack of precipitation.
Link to the Drought Monitor.
Methodology
The triggering aspect of drought is a deficiency in rainfall. The drought monitor focuses on meteorological drought, selecting two drought indices to determine the current drought situation in Saint Lucia.
Two drought indices are calculated to evaluate the situation regarding meteorological drought: The Deviation from Normal (DfN) and the Standard Precipitation Index (SPI). Both indices are evaluated on a monthly basis on six rain gauge stations on Saint Lucia.
The Deviation from Normal (DfN) relates the current monthly precipitation to the normal, average conditions, illustrating thus if currently more or less rainfall enters the water cycle, compared to the average conditions. A zero value of DfN represents the average condition, the scale ranges from -100% (no precipitation) to +100% (twice the normal precipitation).
The Standard Precipitation Index (SPI) performs a more complex analysis and compares the current rainfall to the average rainfall conditions of several months (typically 3, 6, 12 of 24 months), in terms of a water balance. Negative SPI values indicate a rainfall deficit, and positive values characterize a surplus in rainfall.
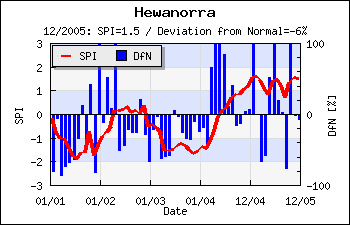
Evolution of Deviation from Normal (DfN) and Standard Precipitation Index (SPI) for the years 2001 to 2005 at the rain gauge Hewanorra.
The example graph of Hewanorra illustrates how the drought monitor works. It shows the evolution of the the two indices (DfN and SPI) over the years of 2001 to 2005. More than average rainfall (positive DfN) clearly shifts the SPI towards positive values, resulting in wet conditions. Two dry situations can be observed, in 2001 and 2003, both years characterized by months with rainfall below average conditions. 2001 was a drought situation in Saint Lucia, 2003 in the northern neighbouring island of Martinique.
Drought is triggered by a natural fluctuation of the availability of water. As important as the natural aspect is how efficiently the available water resources are managed and used. Drought is thus also linked to water usage and misusage and is an issue for the whole population. Its public awareness must be strengthened. A poster shall contribute to the knowledge about drought in the population.
Link to the Drought Poster.
Why is public awareness strengthening important?
Drought and the appropriate usage of the available water resources is an issue which involves the whole population. It is thus necessary to strengthen the public awareness regarding this hazard.
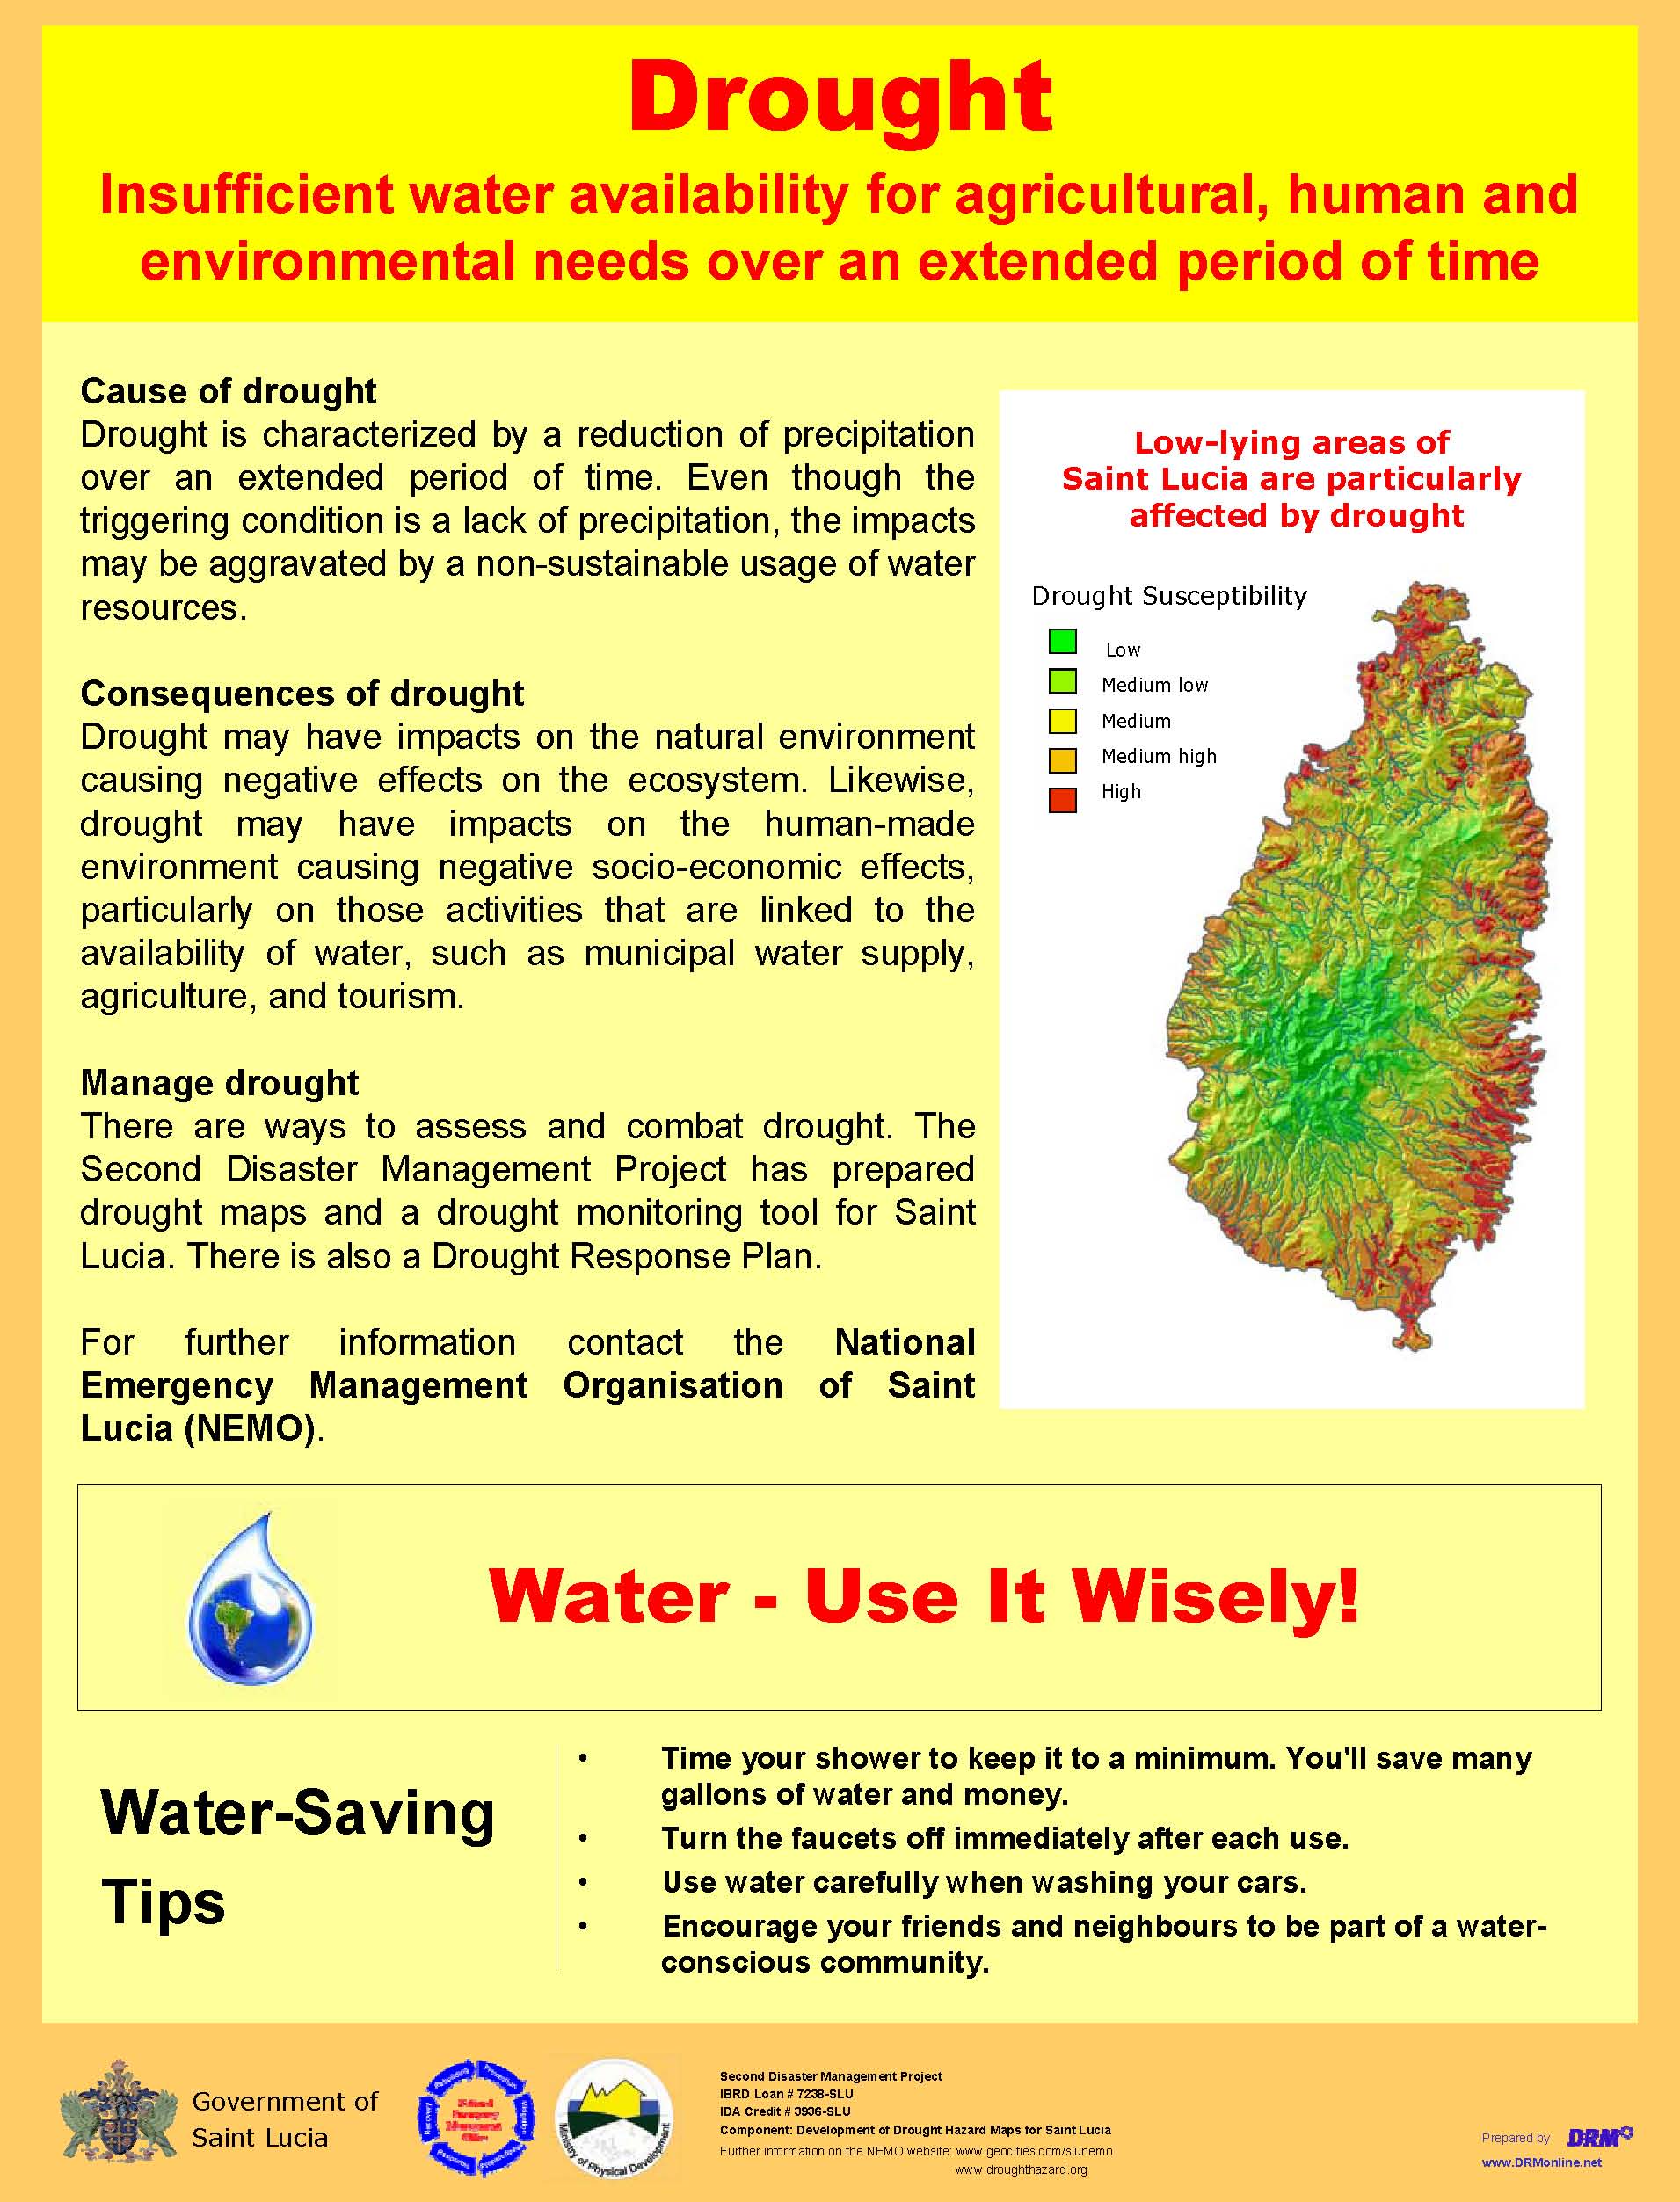
During the project conduction a drought poster was designed, intended to inform the public about drought and giving a few simple rules on water usage.
Download poster
Download the Drought Poster in pdf format or as a high resolution jpeg.
If you have questions regarding drought or other natural hazards in Saint Lucia please contact:
National Emergency Management Organisation of Saint Lucia (NEMO)
Tel. (+1758) 452 38 02
Internet: www.geocities.com/slunemo
E-mail: slunemo@yahoo.com
Ministry of Physical Planning, Housing, Urban Renewal and Local
Government
Internet: www.planning.gov.lc
This page was realized by ![]() and is hosted at www.droughthazard.org.
and is hosted at www.droughthazard.org.